The Dow futures were down over 300 points this morning… and then at open they were positive 200… how on earth can you trade these volatile markets?!
First off. News is what’s moving the markets right now. In case you didn’t know, we are in the midst of a heated trade war brewing up… and depending on the day and who you ask, we are anywhere from absolutely no deal to “very close” to a deal. It’s wild, and the markets will be wild until this settles.
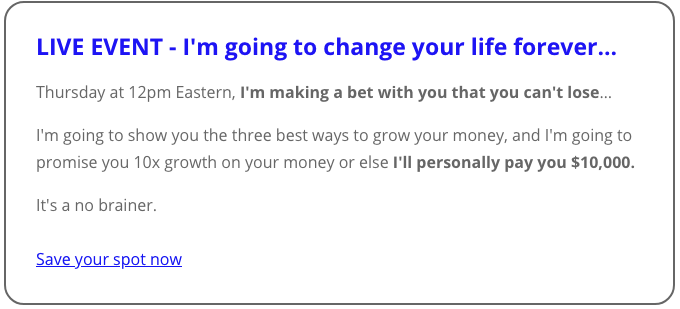
How can you trade these events? Thursday, I’m going LIVE to show you how… and to make it worth your time, I’ll be placing a live trade that you can follow along with. Click here to save your spot absolutely free.
So today’s rundown, I want to show you three critical factors I look at when gauging market sentiment… and the 3rd one you can actually trade.
One of the first places I look after seeing the broad markets is the percentage of stocks above their 200 day moving average. This allows me to see if the overall market is bullish, bearish or neutral.
Something that’s good about using the 200 day simple moving average is the fact that it doesn’t move as fast, so it’ll help keep us away from false alarms.
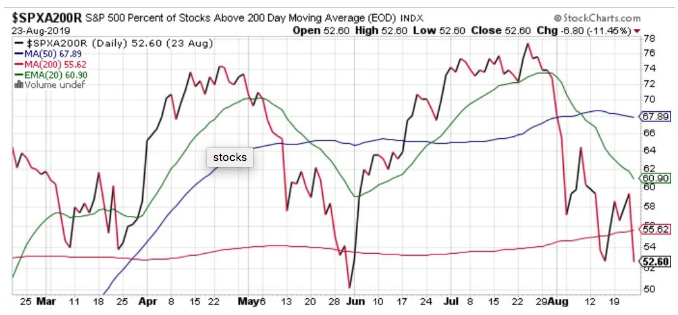
So right now as you see there’s only 52% of stocks above their 200 day line… which is still an overall bullish market, since as you see we haven’t below that 50% mark at all so far in the time frame shown… However, if the market keeps pressing down we will be in an overall sideways market – click here and I’ll explain my #1 play for sideways markets.
The second thing I look at is the Put-Call Ratio.. This will give you an idea of where the big money sits. When it’s above 1.15, the markets are bearish but oversold… below 0.85 the markets are bullish but overbought. Look where we are now:
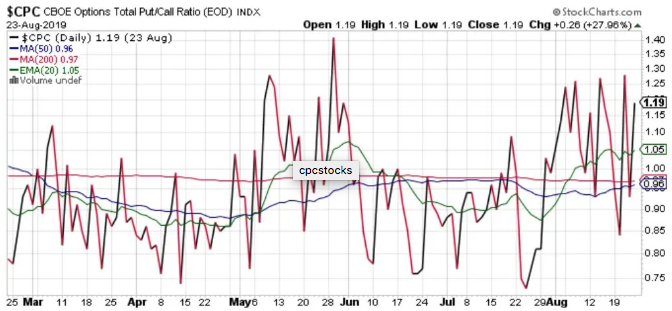
We’re at that 1.19 level – which means oversold – and just another reason we are having a slight bounce today. However, note when the markets are headed up, the $CPC (generally speaking) stays below the red 200 day average, and when the markets are headed south, they are above that line. This is a good gauge to see where big money sits in the market – and gives you an idea of whether or not to be long, short or out.
Lastly, I look at the $VIX – the fear index (and if you want to trade it, I typically use the VXX ETF).
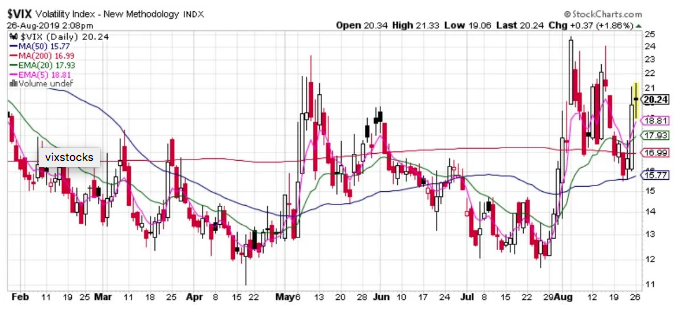
The 20 line is what I call the “threshold level” – below that line we’re in a stable, growing cycle – above the 20 mark, fear is running high. Right now we’re right there. Some days lower, some days higher.
Don’t waste your time and money trying to guess in this market.
Come to the workshop I’m holding this Thursday, and I’ll cover everything in detail of the best way to grow your portfolio in a market like this. Save your seat today.
Talk soon,
Roger Scott
WealthPress